Intervals' method tutorial
Tutorial: How to use R to analyse data from FEA using the intervals’ method
We have developed a new method, named the intervals’ method, to analyse data from finite element models in a comparative multivariate framework.The intervals’ method consists of generating a set of variables, each one defined by an interval of stress values. Each variable is expressed as a percentage of the area of the model occupied by those stress values. Afterwards these newly generated variables can be analysed using multivariate methods.
In the provided example, four armadillo mandibles are studied. They correspond to some of the individuals that were analysed in the paper where the Intervals’ method was introduced for the first time, showing that the proposed method is useful to distinguish and characterise biomechanical differences related to diet/ecomorphology:
Ca. unicinctus: Specialist insectivore
Ch. truncatus: Generalist insectivore-fossorial
D. novemcinctus: Generalist insectivore
Ca. tatouay: Generalist insectivore-fossorial
When using this method, please cite the following reference: Marcé-Nogué, J., De Esteban-Trivigno, S., Püschel, T.A., Fortuny, J., 2017. The intervals method: a new approach to analyse finite element outputs using multivariate statistics. PeerJ 5, e3793. https://doi.org/10.7717/peerj.3793
The R scripts and data files to run the example described below can be download from https://figshare.com/articles/intervals-method-files_rar/12025866
Let’s get started! Below you will find all the necessary steps to obtain the desired number of interval variables and to carry out a PCA using them.
- Set the input parameters for the method (these values are defined by the user): Fixed Upper Threshold FTupper
FTupper = 0.1;Number of intervals: NIntervals (we recommend to define this value using the convergence procedure explained in https://doi.org/10.7717/peerj.3793)
NIntervals = 25;- Read the data. The data must be stored as .csv files in the same folder of the script Each .csv file must contain three rows with: a) the number of the element, b) area/volume of the element and c) von mises stress, respectively.
file.name = list.files(pattern="*.csv")
NFiles = length(file.name)- Create the matrix of intervals Each row with the area percentage for each interval and each file of the matrix with the different models included
data.intervals = matrix(file.name,ncol = NIntervals, nrow = NFiles)

for (f in 1:NFiles) {

  data.values = data.matrix(read.csv(file.name[f], header = TRUE, sep = ","));

  # Get the number of mesh elements of the model

  NElements = nrow(data.values);

  # Create the internal matrix to store the intervals and other data

  Counter.matrix = matrix(0,ncol = NIntervals, nrow = 5);

  # Compute the range values for each interval (Tlower and Tupper)

  Range.values = seq(0, FTupper, by=FTupper/(NIntervals-1));

  # Start the Loop

  for (i in 1:NElements) {
    for (j in 1:NIntervals) {
      if (j == 1){
        if (data.values[i,3] <= Range.values[j+1])
          {
          Counter.matrix[2,j]=Counter.matrix[2,j]+1;
          Counter.matrix[4,j]=Counter.matrix[4,j]+data.values[i,2];
          }
      }
      else if (j > 1 & j < NIntervals){
        if (data.values[i,3] > Range.values[j] & data.values[i,3] <= Range.values[j+1])
        {
        Counter.matrix[2,j]=Counter.matrix[2,j]+1;
        Counter.matrix[4,j]=Counter.matrix[4,j]+data.values[i,2];
        }
      }
      else if (j == NIntervals){
        if (data.values[i,3] > Range.values[j])
        {
        Counter.matrix[2,j]=Counter.matrix[2,j]+1;
        Counter.matrix[4,j]=Counter.matrix[4,j]+data.values[i,2];
        }
      }
    }
  }

  # End the loop

  # Compute the percentage in each interval with respect  to the total area

  for (i in 1:NIntervals) {
    Counter.matrix[1,i]=Range.values[i];
    Counter.matrix[3,i]=100*Counter.matrix[2,i]/NElements;
    Counter.matrix[5,i]=100*Counter.matrix[4,i]/sum(data.values[,2]);
  }

  # Store the vector of intervals for the model f in the matrix of intervals

  data.intervals[f,]=Counter.matrix[5,];

}

data.intervals=as.data.frame(data.intervals);
row.names(data.intervals)=file.name;- Save data and remove variables
write.csv(data.intervals,'matrix-of-intervals.csv');
rm(NIntervals, FTupper, NElements, i, j, f, file.name, NFiles, Range.values, Counter.matrix, data.values)
The following steps are necessary to carry the PCA with the newly generated variables
- install the following packages if required
if (!require('factoextra')) devtools::install_github("kassambara/factoextra"); library('factoextra')
## Loading required package: factoextra
## Loading required package: ggplot2
## Welcome! Want to learn more? See two factoextra-related books at https://goo.gl/ve3WBa
if (!require('ggpubr')) devtools::install_github("kassambara/ggpubr"); library('ggpubr')
## Loading required package: ggpubr
if (!require('FactoMineR')) install.packages('FactoMiner'); library('FactoMineR')
## Loading required package: FactoMineR- read the intervals
stress.distrib = read.csv("matrix-of-intervals.csv", row.names=1, header = TRUE, sep = ",")- compute PCA
col.number = ncol(stress.distrib)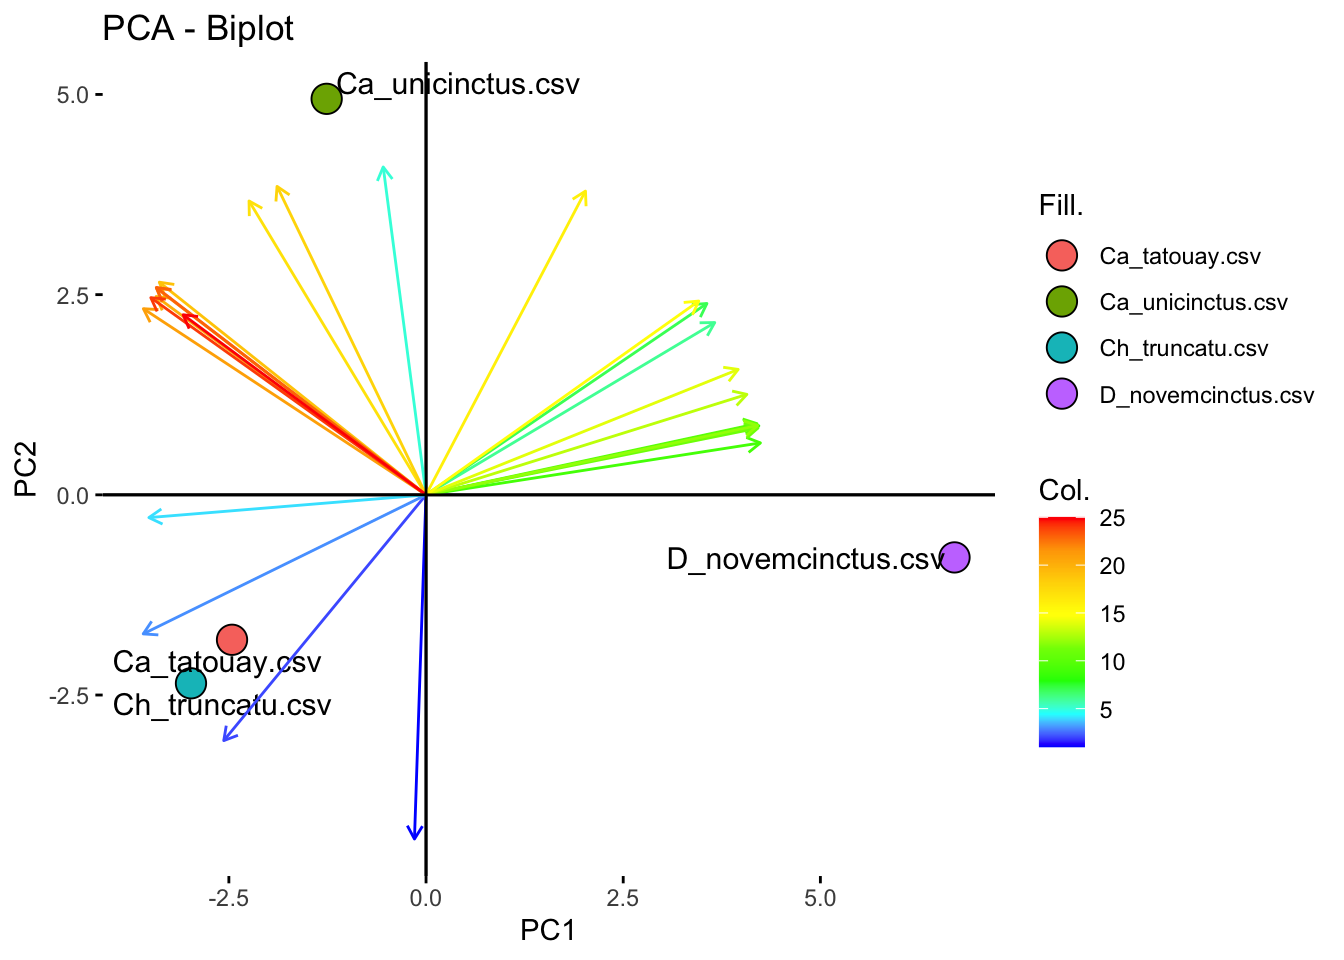
PCA.stress <- PCA(stress.distrib[,1:col.number], graph = FALSE)- Define the parameters and generate the biplot
# colors by group
group.colors = row.names(stress.distrib)

#colors by variable
interval.number = nrow(PCA.stress$var$coord)
interval.vector = seq(from = 1, to = interval.number, by=1 )
interval.colors = interval.vector
interval.palette = c("blue","cyan","green","chartreuse","yellow","gold","orange","red")- Biplot: variables coloured by contribution to PCs
fviz_pca_biplot(PCA.stress,
                mean.point=F,                     #
                axes.linetype = "solid",

                # Fill individuals by groups
                geom.ind=c("point", "text"),
                pointshape = 21,
                pointsize = 5,
                col.ind= "black",                 #
                fill.ind = group.colors,          #
                alpha.ind = 1,                    #

                # Color variable by intervals
                geom.var = "arrow",
                col.var = interval.colors,
                arrowsize = 0.5,

                repel = TRUE) +                   # Avoid label overplotting


  #fill_palette(group.palette) +
  gradient_color(interval.palette)+
  labs(x = "PC1", y = "PC2")+


  theme(
    panel.grid.major = element_blank(),
    panel.grid.minor = element_blank(),
  )
Thomas A. Püschel
Associate Professor in Evolutionary Anthropology
Wendy James Associate Professor in Evolutionary Anthropology at the School of Anthropology and Museum Ethnography, University of Oxford, and Tutorial Fellow at St. Hugh’s College.